Exploration of media and trust before the campaign
This report gives an overview of the political and media landscape at the start of the campaign for the Dutch 2021 Parliamentary Elections. This analysis is based on the first wave of our panel survey with in total 2.400 respondents. We asked them what their vote intention is for this election, how they voted in the previous election, how well they trust various media and institutions, and what media they consumed in the past weeks.
Demographics
Let’s start this exploration by a look at the demographics of the voters, especially age and education.
Media use by Age and Education
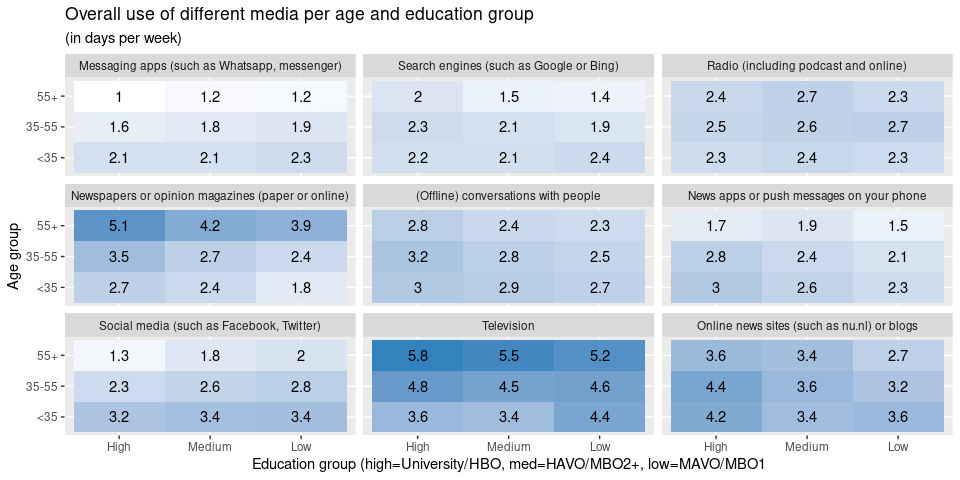
As we can see, Television is the most widely consumed news channel for all age and education groups, but with a clear smaller share for respondents under 35, except for those in the lowest education group. Unsurprisingly, print newspapers ad opinion magazines are mostly consumed by highly educated older voters, while younger voters prefer online news channels, especially the highly educated voters younger than
- Social media and news apps are seen as a news source especially for young people, regardless of education.
Vote intention per Age and Education
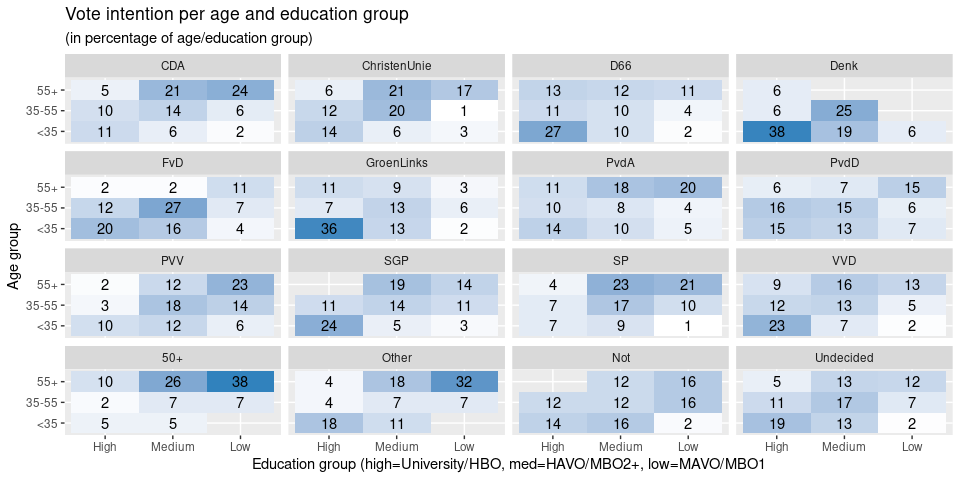
The figure above shows how the age and education for the respondents planning to vote for each party. There are some clear patterns. On the right, the VVD mostly appeals to young and highly educated voters, while CDA and PVV are more popular with older and less highly educated voters. On the left, D66 and GroenLinks appeal to the young and educated class, while PVdA apd SP appeal more to the older and less educated voter.
Demographics per intended party
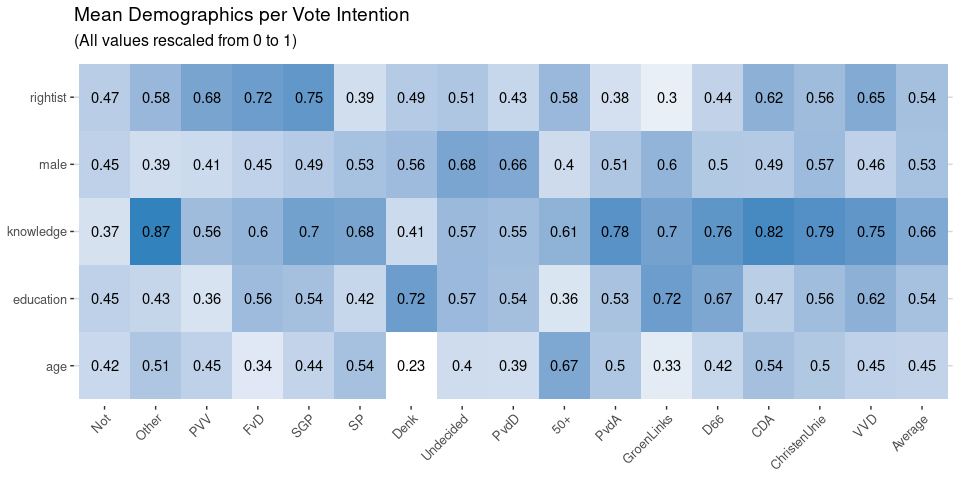
The able above shows the “mean voter” for each party, where each demographic is rescaled to range from 0 to 1. Voters for centrist parties have on average a bit more political knowledge, while the smaller parties D66, GroenLinks and Denk have the highest level of education.
Interestingly, undecided voters are more likely to be male, younger, slightly better educated, but less knowledgeable about politics than the average voter.
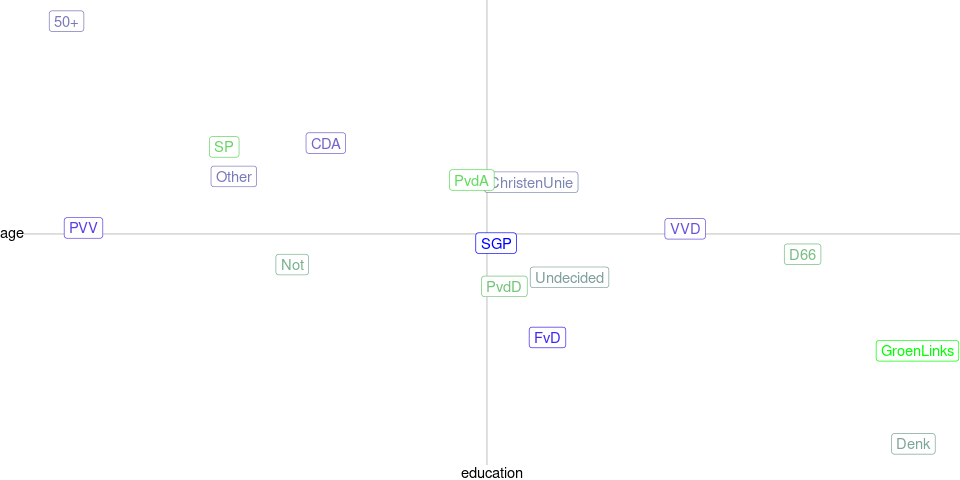
Placing each party by the demographic of its mean voter, we get an alternative electoral compass: (color indicating average position of respondent on left-right scale)
Vote change
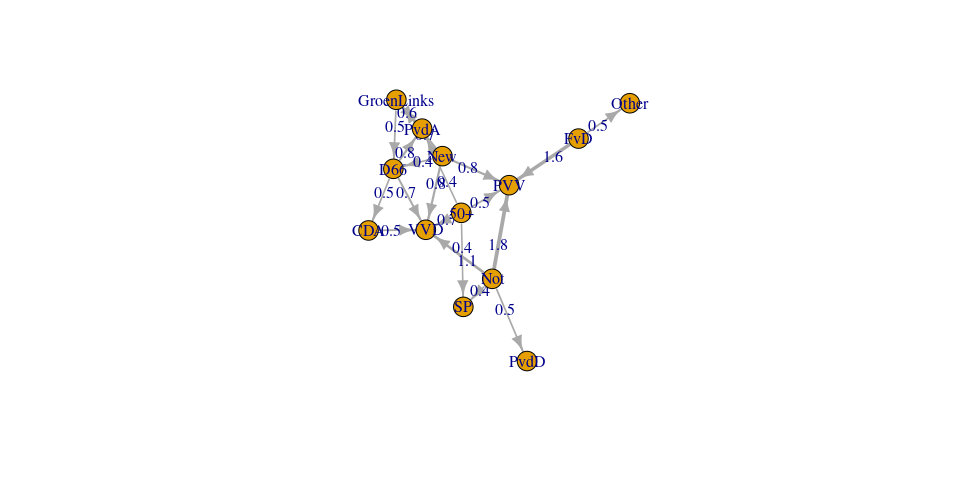
The above shows changes between current vote intention and the self-reported previous vote (ignoring undecided voters). Interestingly, PVV does not draw new voters from existing parties apart from the (imploded) 50+ and FvD, but mostly draws on voters that did not vote in the previous election, either from choice or because they were inelibible (i.e. new voters). VVD also draws from both groups and from 50+, while also drawing from the coalition parties CDA and D66. Non-voters in 2017 also now consider SP and PvdD. Thus, while VVD and PVV do not compete directly, both do draw from the same pool of new and disgruntled voters.
Media Use by Vote Intention
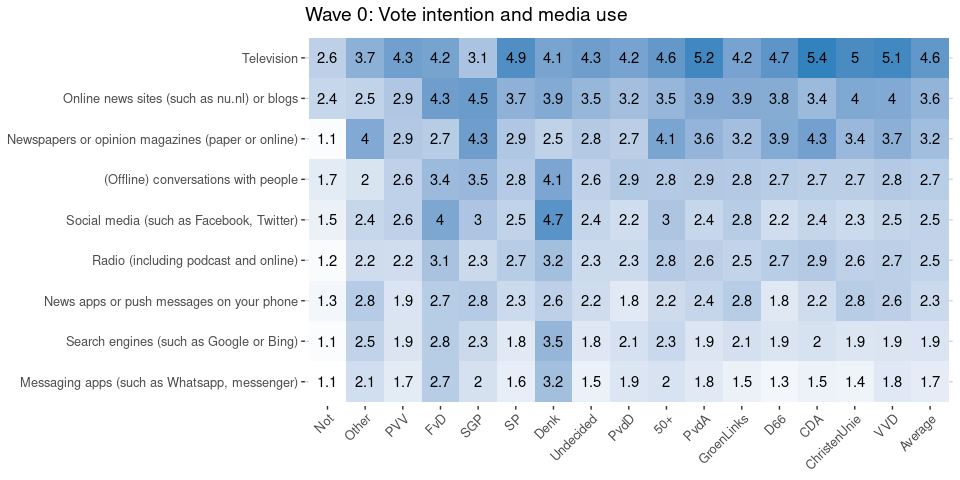
In the competition for voters the media play a crucial role. The table above shows overall media use by current vote intention. As seen before, TV is the most frequently used channel, followed by online nad print news. Overall, voters for the centrist parties consume more news, while non-voters and voters for especially PVV consume signifianctly less news in all channels. Both FvD and Denk voters rely more heavily on social media and especially less on print media.
See the last part of this report for data on use of particular titles or sites within each category.
Trust
One crucial question is whether people have trust in media and democracy. We have asked respondents to rank their trust in a number of institutions on a scale of 0 to 10, and we also asked them to rank a list of specific media channels.
Trust in Institutions
 Download data: Wave 0: Trust in
Instituties
Download data: Wave 0: Trust in
Instituties
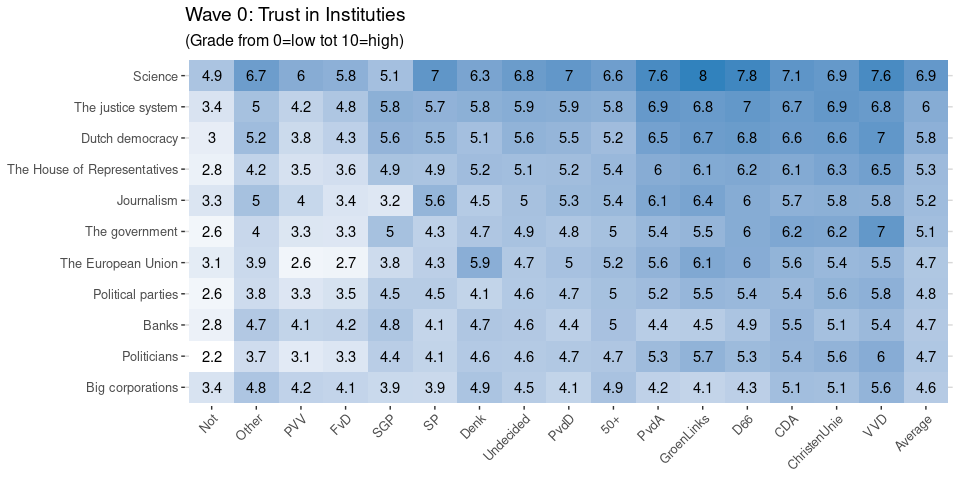
The table above shows the trust in a number of institutions. Most respondents have relatively high trust in science, the justice system, and democracy. When looking at journalism and specific political institutions, trust is lower, and trust in banks and corporations is even lower.
Looking at the trust of voters for the various parties, we see that again voters for the centrist parties have highest trust, while non-voters and voters for more fringe parties have less trust in media and politics, and non-voters also have very low trust in science.
Trust in Media
 Download data: Wave 0: Trust in
Media
Download data: Wave 0: Trust in
Media
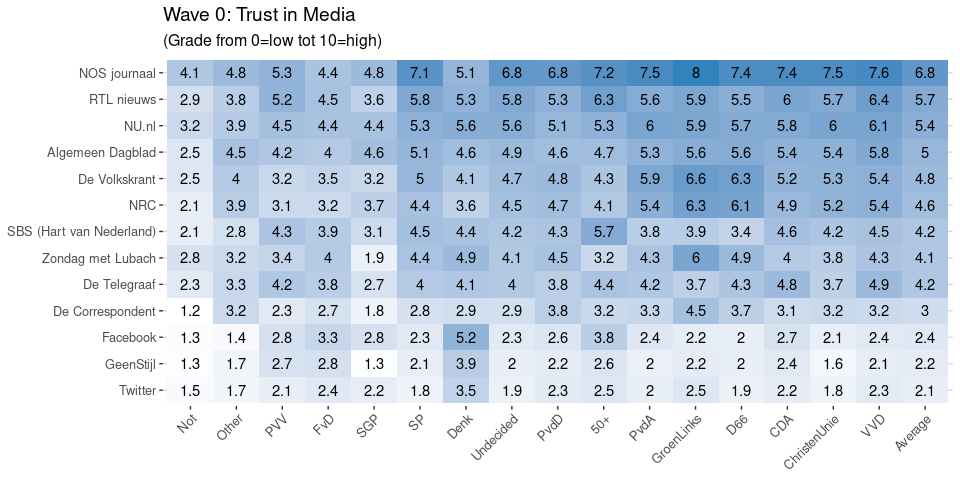
Looking at trust in specific channels, overall the TV news broadcasts and mainstream media channels such as nu.nl and AD score best, and social media score worst. We also see the same breakdown between high-trust centrist voters and low-trust fringe voters. Interestingly, Denk voters have relatively high trust in social media dn low trust in (Dutch) TV channels and newspapers.
Trust in democracy
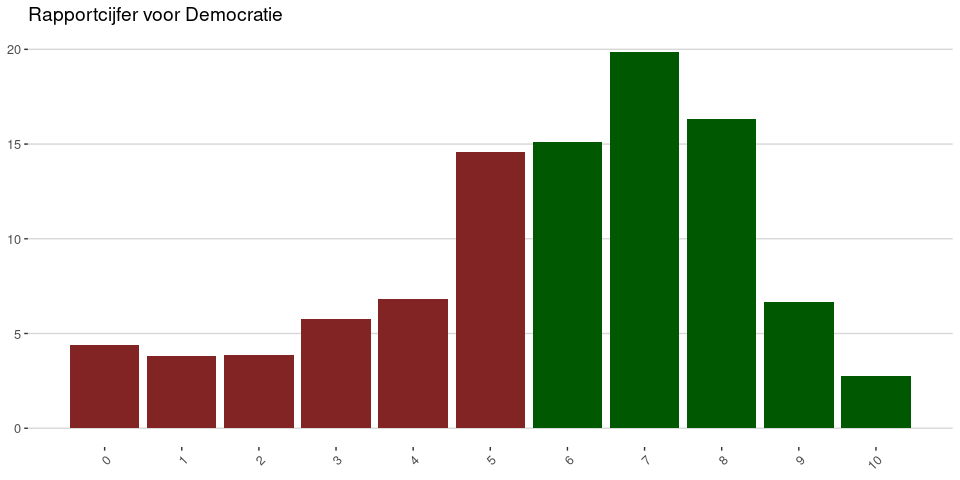
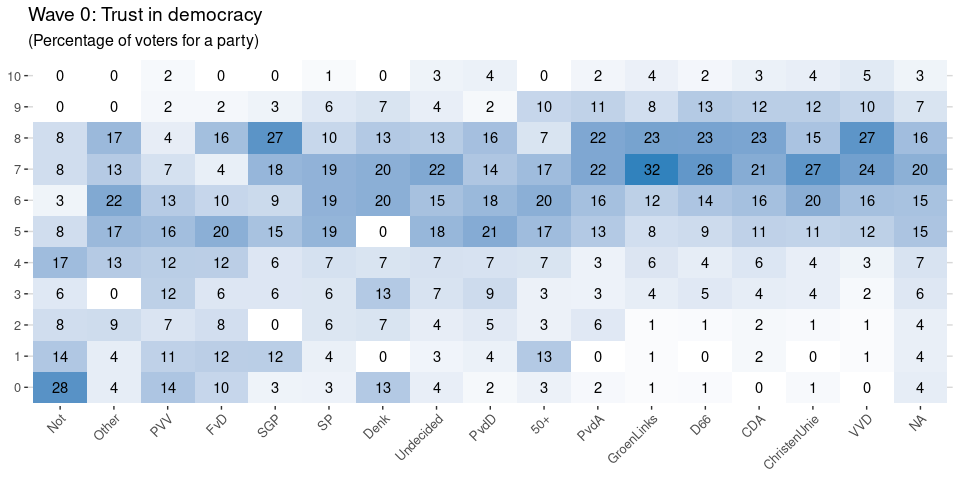 Download data: Wave 0: Trust in
democracy
Download data: Wave 0: Trust in
democracy
Use of particular media titles / sites
Use of Newspapers
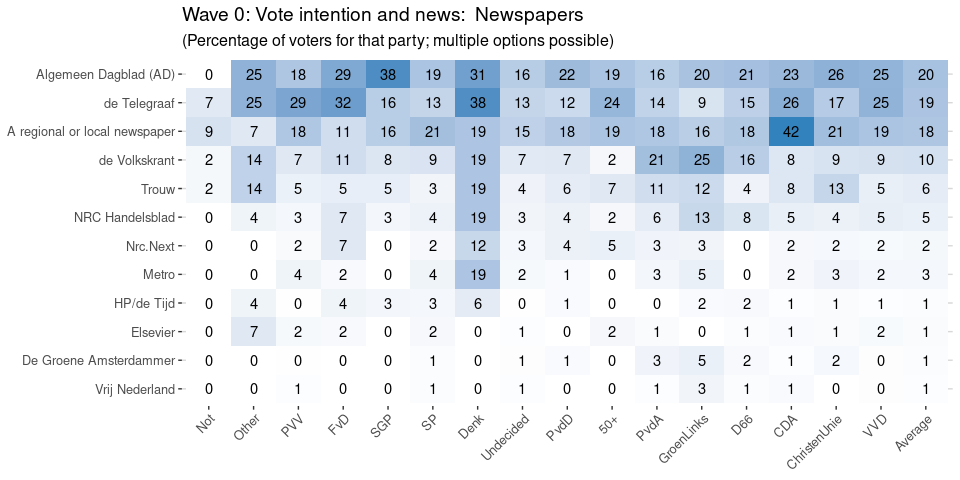 Download data: Wave 0: Vote
intention and news:
Newspapers
Download data: Wave 0: Vote
intention and news:
Newspapers
Use of TV
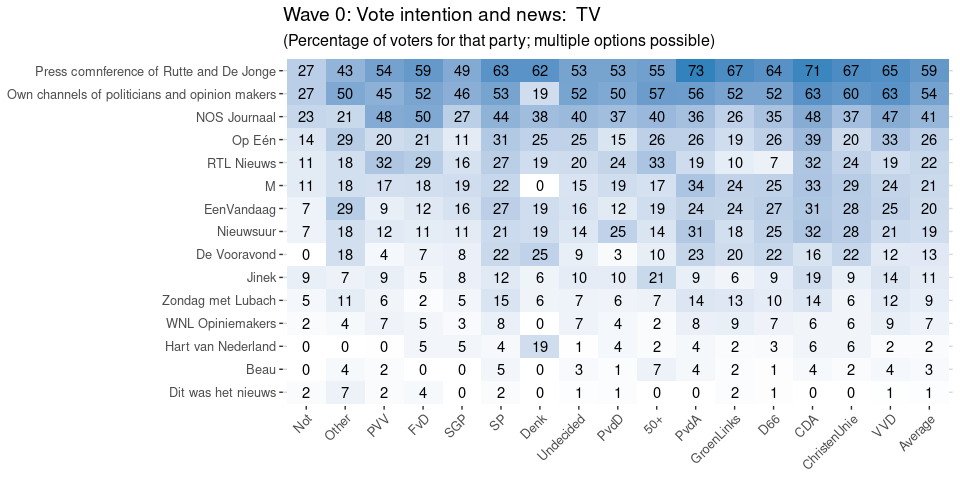 Download data: Wave 0: Vote
intention and news: TV
Download data: Wave 0: Vote
intention and news: TV
Use of Online
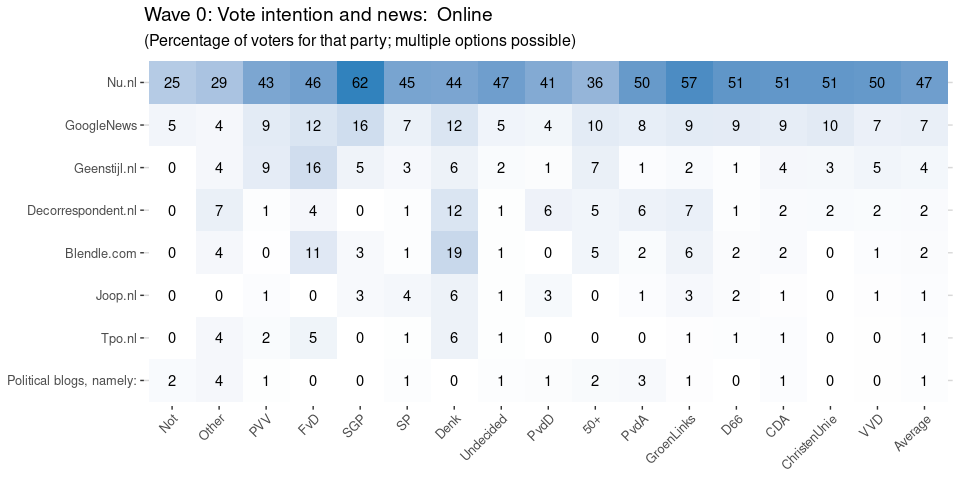 Download data: Wave 0: Vote
intention and news: Online
Download data: Wave 0: Vote
intention and news: Online
Use of Social
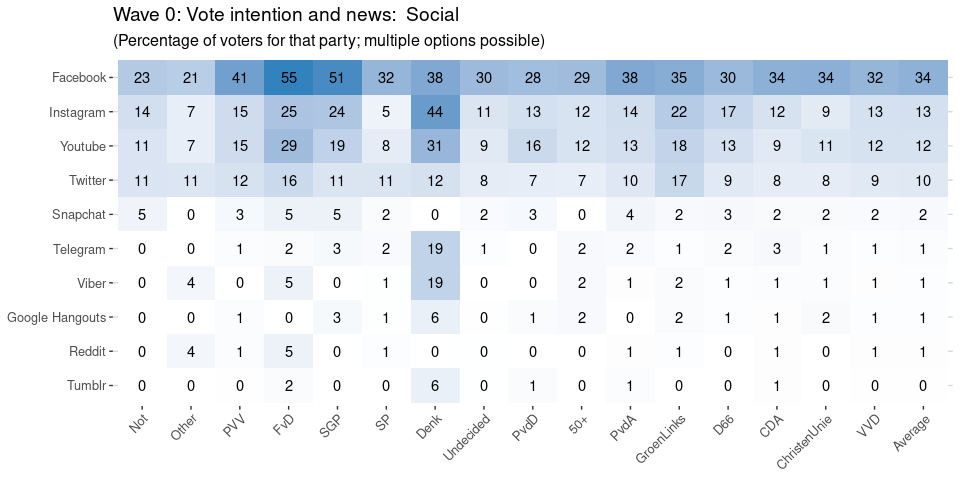 Download data: Wave 0: Vote
intention and news: Social
Download data: Wave 0: Vote
intention and news: Social
Use of Apps
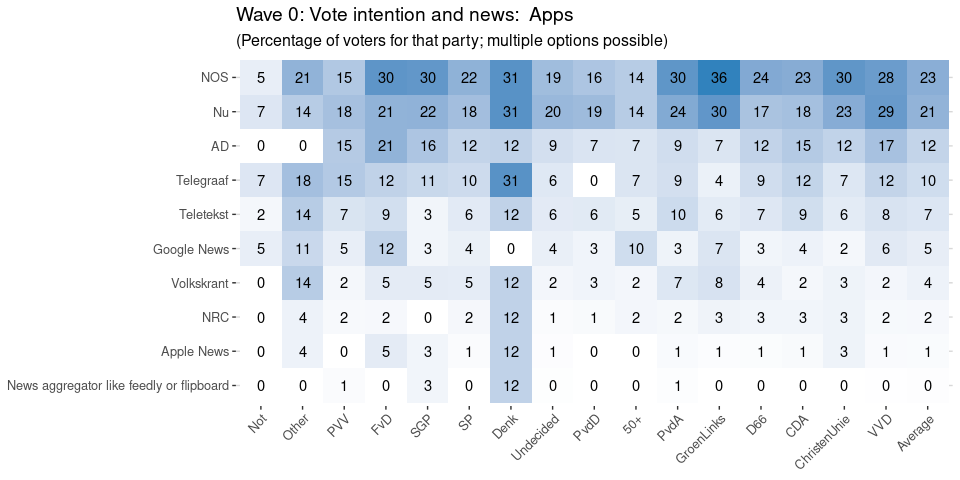 Download data: Wave 0: Vote
intention and news: Apps
Download data: Wave 0: Vote
intention and news: Apps